Installation and usage of the platform
Node monitoring configuration in the Sandbox mode
A node, running in the Sandbox mode, has the ability to set up monitoring of its performance using InfluxDB and Grafana.
To install and configure monitoring, first stop the running containers using the docker-compose down command.
Install the Grafana Docker image:
docker run -d --name=grafana -p 3000:3000 grafana/grafana
Install the Docker image of InfluxDB:
docker run -d --name influxdb -p 8086:8086 -e INFLUXDB_DB=sandbox_influxdb -e INFLUXDB_ADMIN_USER=sandbox_influxdb_admin -e INFLUXDB_ADMIN_PASSWORD=sandbox_influxdb_pass quay.io/influxdb/influxdb:v2.0.3
Hint
Note that these steps are necessary to pre-install Grafana and InfluxDB. If you intend to use the Docker Compose, you can skip them: after modifying the docker-compose.yml file below and starting the containers, the images of both services will be downloaded and installed automatically, if not installed before.
Go to the
./configs/nodes/node-0directory and open the node configuration file node.conf with administrator rights. At the end of the configuration file, add the following parameters of the monitoring services:
# Performance metrics
kamon {
  # Set to "yes", if you want to report metrics
  enable = yes

  # An interval within metrics are aggregated. After it, them will be sent to the server
  metric.tick-interval = 1 second

  # Reporter settings
  influxdb {
    hostname = "localhost"
    port = 8086
    database = "sandbox_influxdb"
    time-units = "ms"

    authentication {
      user = "sandbox_influxdb_admin"
      password = "sandbox_influxdb_pass"
    }

    environment.host = "node-0"
  }
}

# Non-aggregated data (information about blocks, transactions, ...)
metrics {
  enable = yes
  node-id = "node-0"

  influx-db {
    uri = "http://localhost:8086"
    db = "sandbox_influxdb"

    username = "sandbox_influxdb_admin"
    password = "sandbox_influxdb_pass"

    batch-actions = 100
    batch-flash-duration = 1s
  }
}
Open the docker-compose.yml file and add the monitoring services deployment parameters.
Full listing of the docker-compose.yml file
Launch the platform and enter the Grafana client application. To do this, start the platform containers using the
docker-compose up -dcommand and wait for the deployment to complete.
Then open the Grafana client available on port 3000:
For client authentication, use the data set in the environment subcategory of services: grafana: section in the docker-compose.yml file:
services:
  grafana:
    image: grafana/grafana:latest
    hostname: grafana
    container_name: grafana
    environment:
      GF_SECURITY_ADMIN_USER: 'admin'
      GF_SECURITY_ADMIN_PASSWORD: 'pass'
Connect the platform database to Grafana. To do this, click the Configuration tab and go to the Data Sources category:
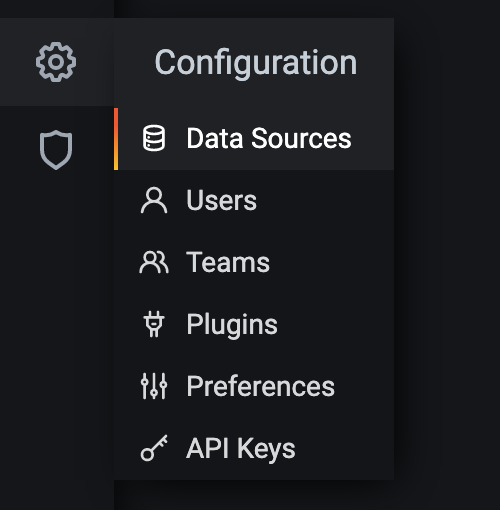
Add a new data source by clicking Add Data Source and select InfluxDB from the suggested list.
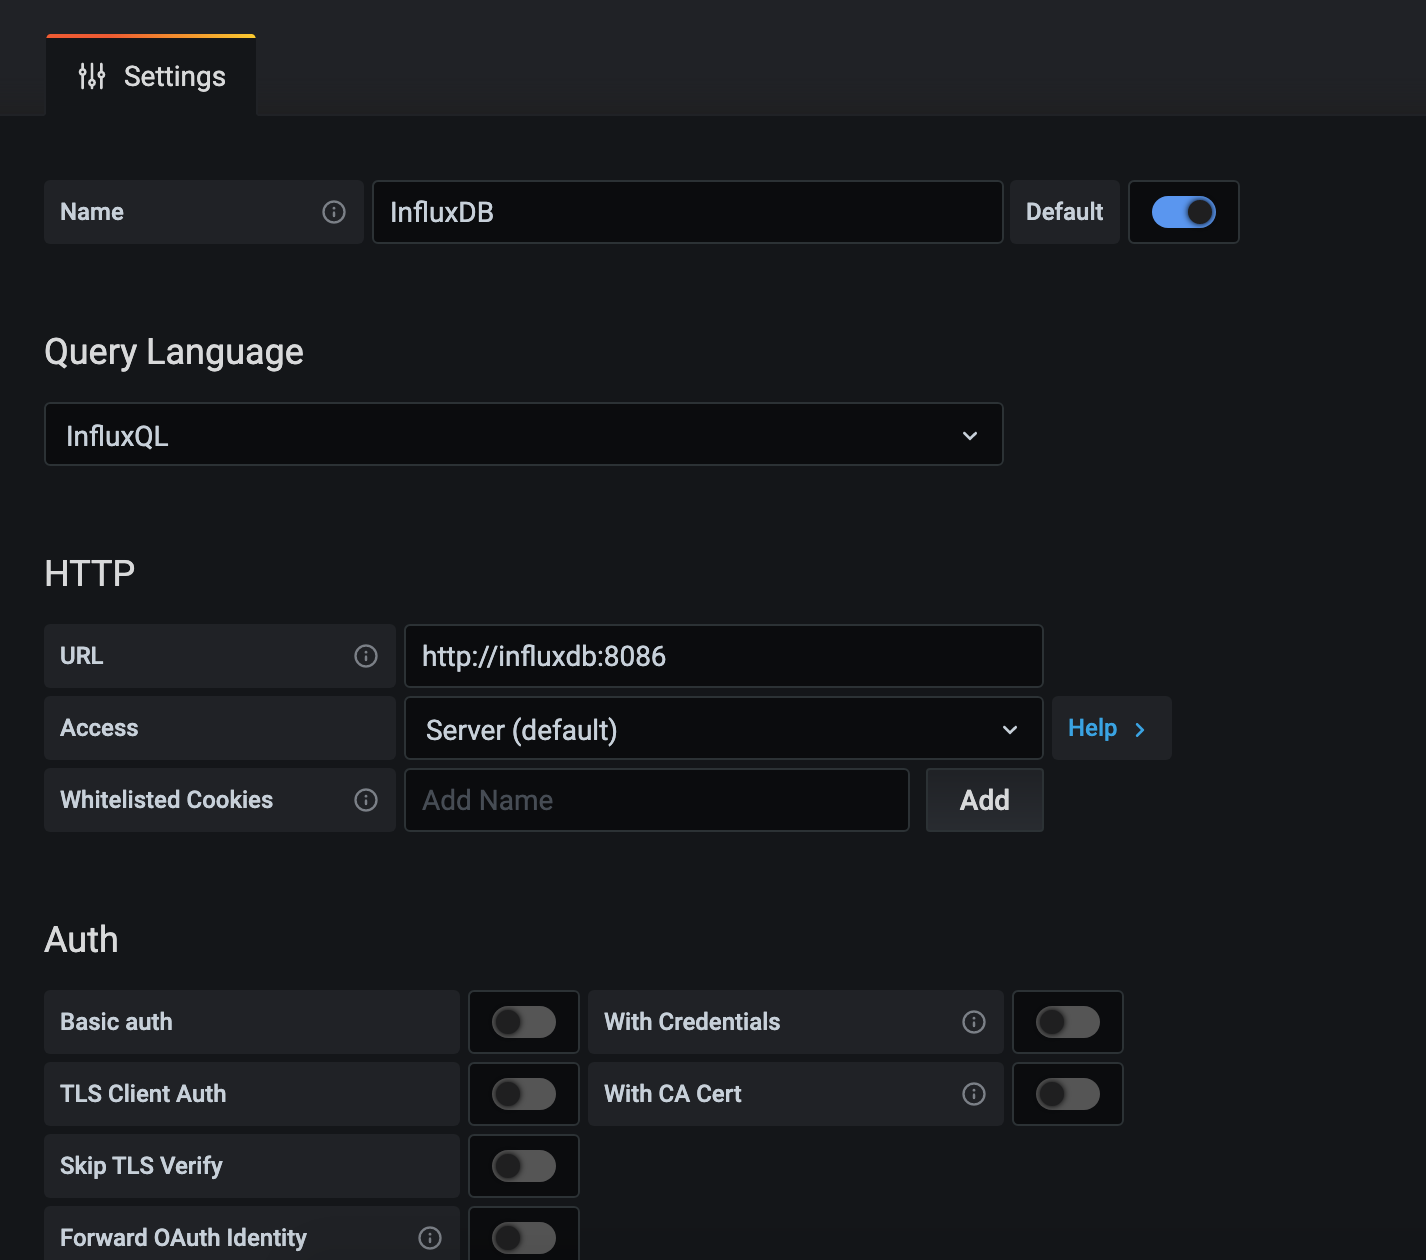
Then configure the database used by the platform.
HTTP section, URL field: http://influxdb:8086
InfluxDB Details section: enter data set in the environment subcategory of the services: influxdb: section in the docker-compose.yml file:
influxdb:
    image: influxdb
    hostname: influxdb
    container_name: influxdb
    environment:
      - INFLUXDB_DB=influxdb // database field
      - INFLUXDB_ADMIN_USER=admin //  user field
      - INFLUXDB_ADMIN_PASSWORD=pass // password field
Click Save & Test. If the database is successfully connected, the message Data source is working will appear.
Set up data visualization in Grafana
To do this, click + (Add) on the left panel of the client and click the Import tab.
In the Import via panel json window, insert the json file containing the data visualization parameters.
Then click Load. In the Options window, select the desired panel name, or leave the default sandbox name.
Click the Import button.
You will then be able to view your demo platform metrics on the panel you have created. Go to the Dashboard/Manage tab and select the sandbox panel to open it.